seeking arrangements
While the language of vision perseveres, it is important not to assume a direct correlation between vision as a sense and visualization as an object and practice. Married initially to psychology, and now digital computation and algorithmic logic, the substrate and content of this practice has often had little to do with human sense perception or the optic system. Moreover, with the rise of emphasis on haptic interactions and interactivity, visualizations also often take multisensorial modes. Vision cannot be taken, therefore, as an isolated form of perception, but rather must be understood as inseparable from other senses.
Orit Halpern, Beautiful Data
This class is about the use and misuse of maps, charts, and graphs as tools of arranging, ordering and representing ideas. We will use JQuery and other libraries to arrange the data we gathered last week, thinking about different approaches to representation.
before class:
Please go through the following tutorial in your own time before class! If you’re not able to, let me know.
tutorial:
Here’s a video of me going over the tutorial, to play along at home.
This week we’re going to be looking at arranging our data-sets using jQuery. I’ll be going through the tutorial using the vegetable cooking times data-set from last week. I’ve simplified it a bit to make this part easier!* To get the files, download this folder from github. You can either download it as a zip, or type
git clone https://github.com/agnescameron/hunter-vegetables.git
cd hunter-vegetables
into your terminal. The files you’re interested in are index.html, veg.js and main.js
NB: if you try and make this code run on the veg.js file from last week, it won’t! Download the new version!
* (if anyone’s curious as to how I simplified the file, it was using a regular expression, which can be found here, along with the original file. regexs are really cool and powerful tools for searching/replacing, and if you wanna learn more about them hmu.)
jQuery
First thing we’re going to try out is adding jQuery to our files.
jQuery was first introduced in 2006, and is an extension of the Javascript language. It’s designed to make it much easier to navigate the DOM than Javascript by itself, and it’s extremely popular. I’d recommend using it on really any site where you’re going to be integrating Javascript to manpulate the DOM.
Adding jQuery to your project is super simple. All you need is to include this line in the header of your HTML:
<script src="https://ajax.googleapis.com/ajax/libs/jquery/3.4.1/jquery.min.js"></script>
This requests the jQuery file from Google, and adds it to your page just like a normal Javascript file. You can also download the file here, and add it to your code just like you would a normal JS file.
So: let’s add it into the HTML.
In order to check that we’ve loaded it in correctly, we’ll want to try and run a simple line of jQuery.
$(document).ready(function(){
	console.log('hello!')
});
This is a really common pattern in jQuery, and one we’ll use a bunch.
- The
$tells the browser that the next line of code is going to be jQuery. You need this, otherwise it’ll just think you want to use normal Javascript, and won’t understand your code (document)refers to the DOM -> just like when we usedocumentindocument.getElementById.ready(function(){ }:readyis a method ofdocument, that triggers when the document has loaded. This is really useful for code that requires elements to have loaded into the page first! Thefunction() { }syntax is one of the anonymous inline functions we’ve been meeting as we go along: these are really common in writing good jQuery!
Open up the HTML page in your browser, and take a look at the console. You should see:
hello!
If you get an error along the lines of $ is not defined, this means that your jQuery has not loaded properly. This is probably for 2 reasons: either you’re missing the tag in your HTML, or your jQuery file is being loaded after the JS file that’s calling it. Remember: browsers read through files one at a time, so if you want to use jQuery in a file, that file needs to get included after the line incliding the jQuery file. (so: just always put jQuery at the top of the <head>)
jQuery and the DOM
jQuery’s main feature is making it much, much easier to interact with DOM elements. Last week, if we wanted to add some text to the div vegbox, we had to do:
document.getElementById('vegbox').innerHTML = 'hello, vegetable'
Now, we can achieve the same thing with much less:
$('#vegbox').html('hello, vegetable')
Neat! Notice that, now, our selector for id is the same as in CSS, a # symbol (fun fact: originally called an Octothorpe). This is true for classes, types and pseudo-classes (like :hover) too!
so, to get a div element you’d use $('div'), and to get an element with a class, you’d use ('.classname')
Let’s try an iterator! First, we need something to iterate on, so let’s add a couple more elements to the page. Just a couple of empty divs should do for now. Give each one an id tag.
<div id="something"></div>
<div id="something else"></div>
Remember our forEach iterator from last week? This is super similar:
$('div').each(function() {
	console.log($(this).attr('id'))
})
This will:
- select each
divon the page - for each
div, it will get the attribute (eg, HTML attributes likeidclasssrcetc)id, then print it. It selects the divs individually using thethiskeyword, which just means ‘this thing that we’re thinking about right now in the scope of this function’
adding page elements
jQuery also gives us the ability to make page elements. We can do this using vanilla JS too, but, just like selecting stuff, jQuery irons out a lot of annoyances and makes our life a lot easier.
Go through and delete all the divs you just made in the HTML. Now, use jQuery to add a new one:
$('body').append("<div> eating peanuts </div>")
This appends a div containing some text onto your page body. Perhaps we want to do something a bit more elaborate than this! Let’s try making a new div with some attributes:
let newDiv = $('<div/>', {
    id: 'peanuts',
}).html("love them peanuts")

$('body').append(newDiv)
This looks pretty different, but it’s actually nearly the same as before.
- we create a variable called
newDiv, which will hold our new element - we invoke jQuery with the
$sign (important, the browser needs to know we’re using jquery) - we use
$('<div/>', {id: 'peanuts'})to create adivelement, with attributes contained in a JSON object. This is equivalent to writing<div id=peanuts> </div>, but it means that we can really easily incorporate variables into our HTML attributes, something we’ll want later - we change the
htmlproperty of the new element to include some text. We did this earlier, and all it does is adds stuff inside the div - finally, we append to the body like before. remember: every line of jQuery gets a new
$symbol!
Open up your page and make sure it worked! You should see some text in the top left that says love them peanuts.
So, now we’re rolling with jQuery, we can start incorporating some of the object code from last week.
Remember our friend forEach? Let’s make some divs with it:
vegTimes.forEach( function(element, index) {
	let vegDiv = $('<div/>', {
    	id: element.name
	}).html(element.name)

	$('body').append(vegDiv)
})
jQuery can also be used to style elements! This is also pretty convenient, as it allows you to basically write CSS (with the slight caveat that everything that’s not a variable needs to get put in quotation marks).
Let’s take a look at our vegetable list: each of the objects has a property color: what if we wanted to use that as a variable?
Just as we can change the HTML inside the div using the .html() method, jQuery has a corresponding .css method that lets us
vegTimes.forEach( function(element, index) {
	let vegDiv = $('<div/>', {
    	id: element.name
	})
	.html(element.name)
	.css({"background-color": element.color})

	$('body').append(vegDiv)
})
the joy of flexbox
A really common task in web development is to have an unknown number of objects (products in a store, projects in a portfolio, recipes in a collection…) and to display them in a visually-consistent, responsive manner.
There are lots of ways to do this, but the two main ones are CSS grid and Flexbox. Today we’ll look at flexboxes, but if you want some more notes on grids and other techniques, notes from the ‘responsiveness’ week in my parsons class go into a lot more depth.
Flexbox is interesting as it deals with layout one dimension at a time – either in terms of rows or in terms of columns, using the flex-direction property. That means: if you want your boxes to be arranged left-to-right (then make new lines when they run out of room), set flex-direction to row. If not, set flex-direction to column. (to go backwards, row-reverse or column-reverse). This direction is called the main axis. The other axis (at 90 degrees) is called the cross axis.
Flexboxes are created by putting some boxes inside another box. The outer box is what makes the boxes flexboxes: we make it a flexbox by setting the display property to flex.
In order to test out a flexbox, let’s make a flex-container, and put some divs inside it! First, add a div with class flex-container to your HTML. This will be where our flexboxes will go.
<div class="flex-container"></div>
Now: open up your style.css file for the first time! Add in the line:
.flex-container {
	display: flex;
	flex-direction: row;
}
Now, let’s add some boxes! The code can stay pretty much the same as before, but instead of appending to the body, we’re going to append to the flex-container itself!
vegTimes.forEach( function(element, index) {
	let vegDiv = $('<div/>', {
    	id: element.name
	})
	.html(element.name)
	.css({"background-color": element.color})

	$('.flex-container').append(vegDiv)
})
Load the page and check it out!
You should see something like this:
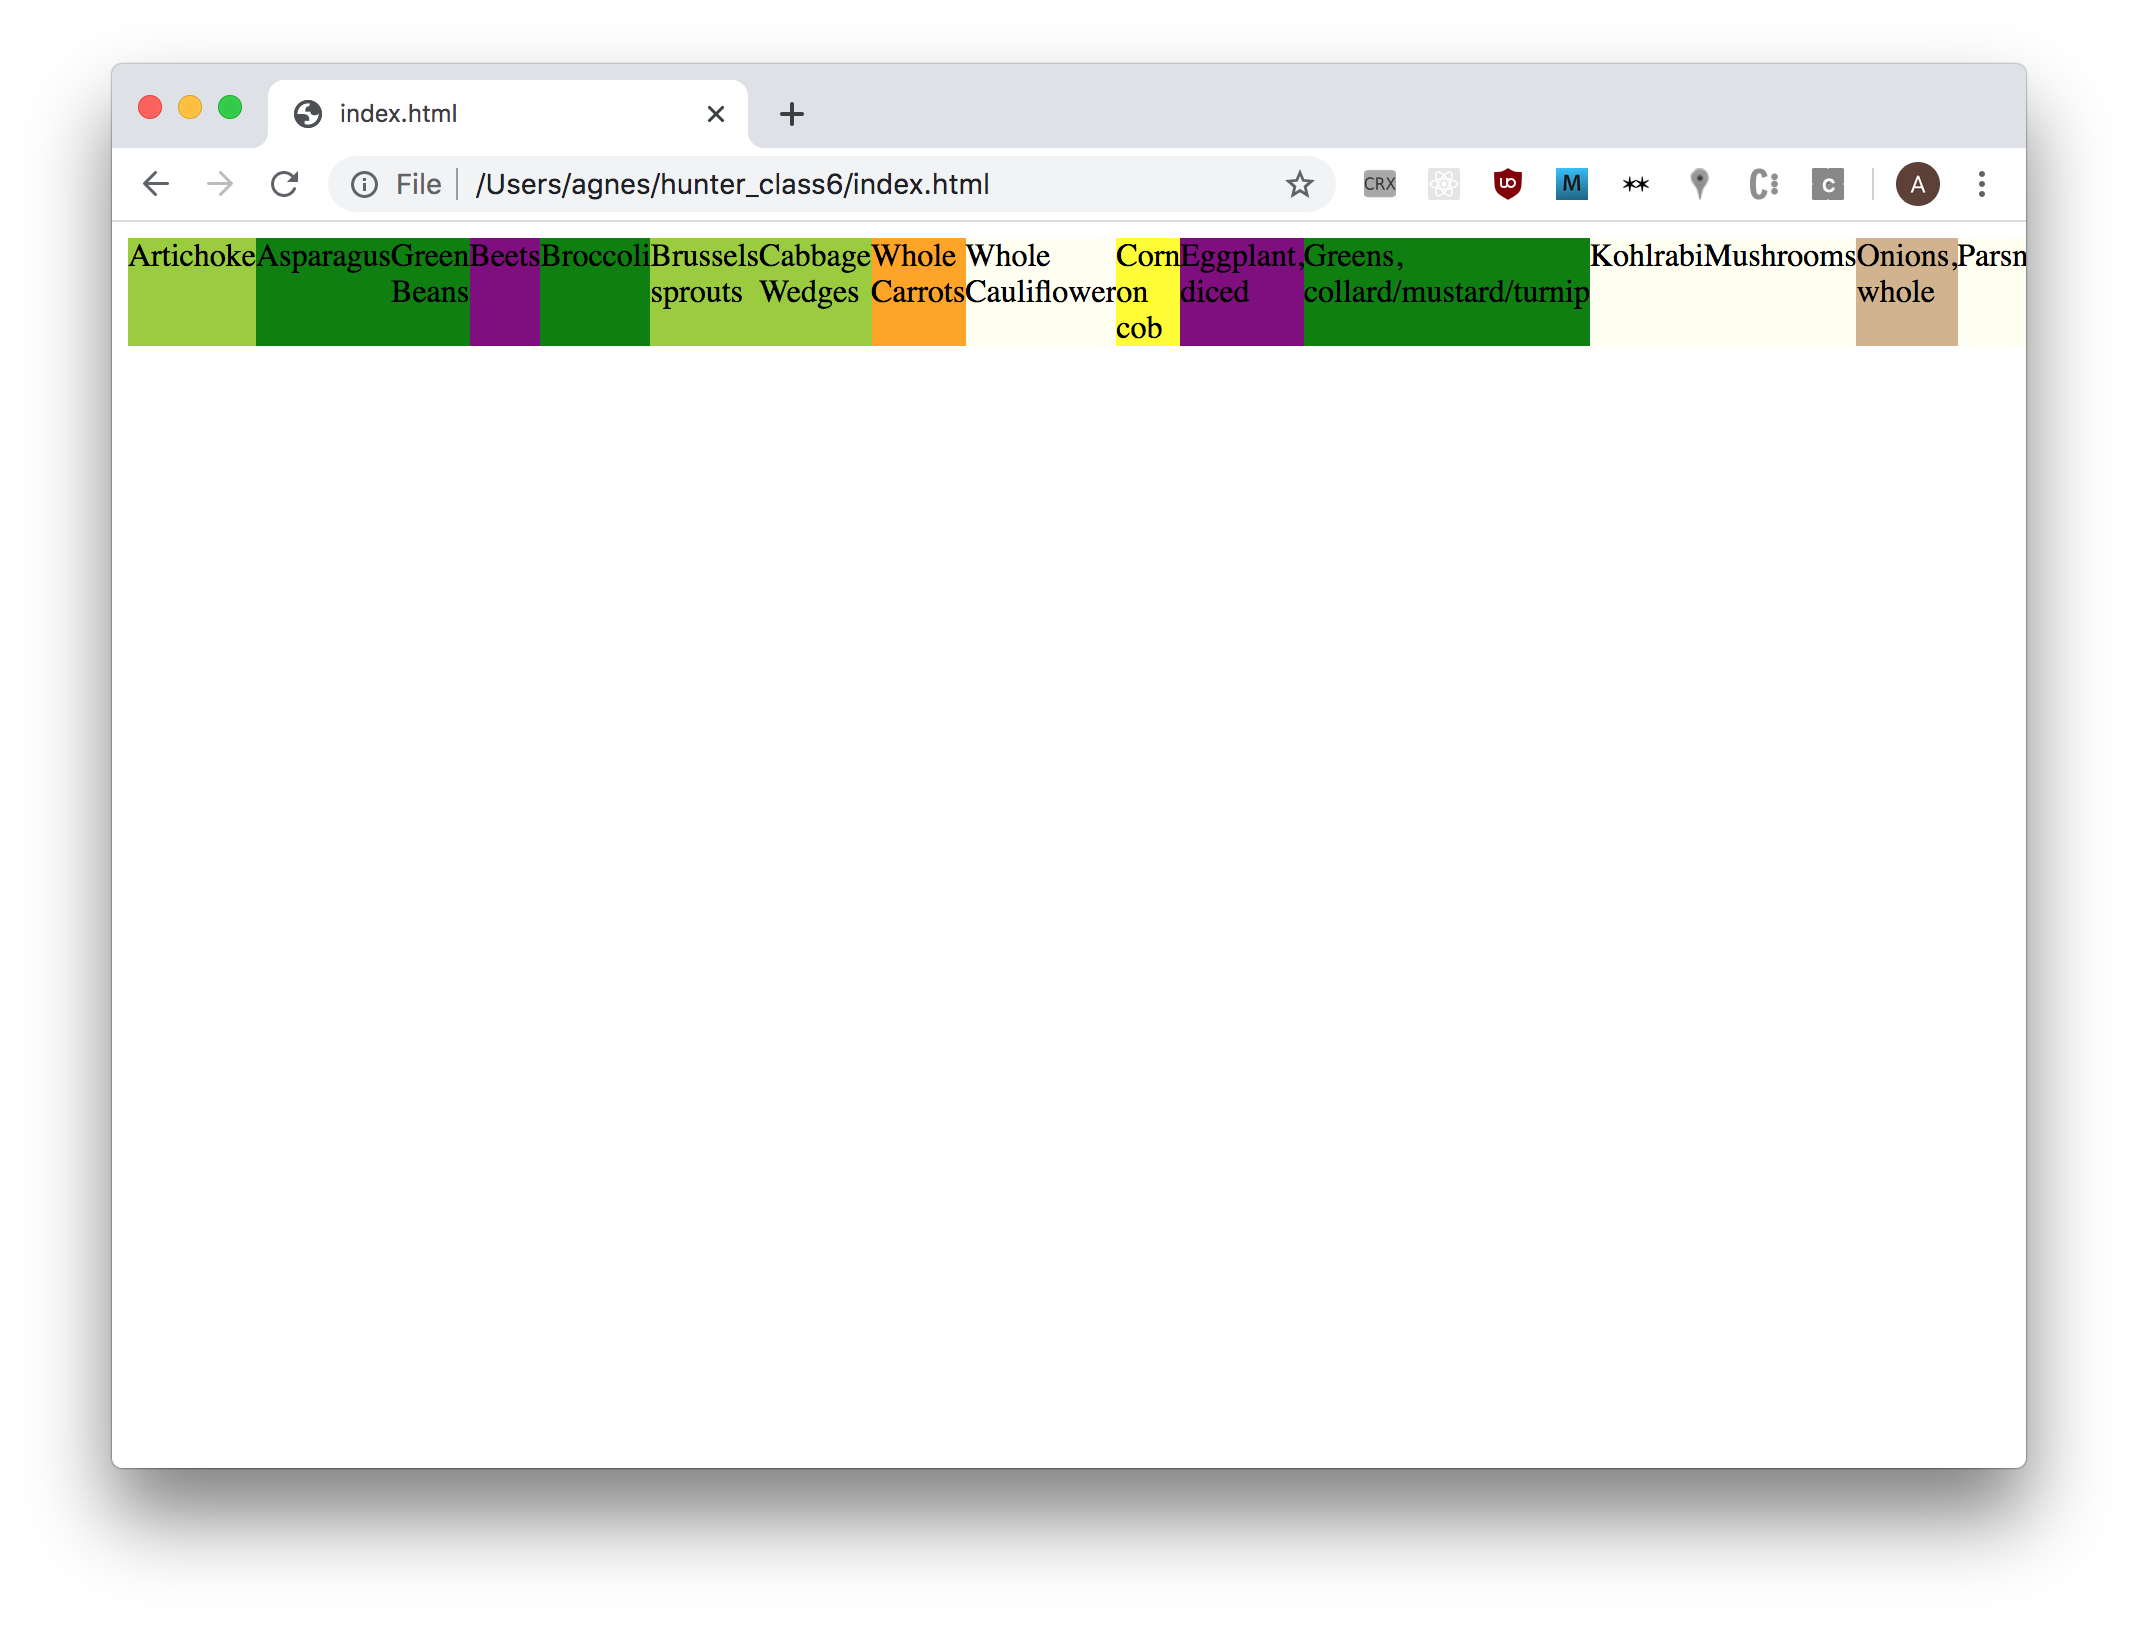
So far, so unimpressive.
To wrap our boxes onto multiple lines (or multiple columns, if our main axis is columns), we set the flex-wrap property in the parent grid-container. If we set it to no-wrap, our boxes would shrink to fit the width of the grid-container, and expand in the cross axis if their contents was too large. See this guide for more wrapping details.
.flex-container {
	display: flex;
	flex-wrap: wrap;
}
Now, we get this:
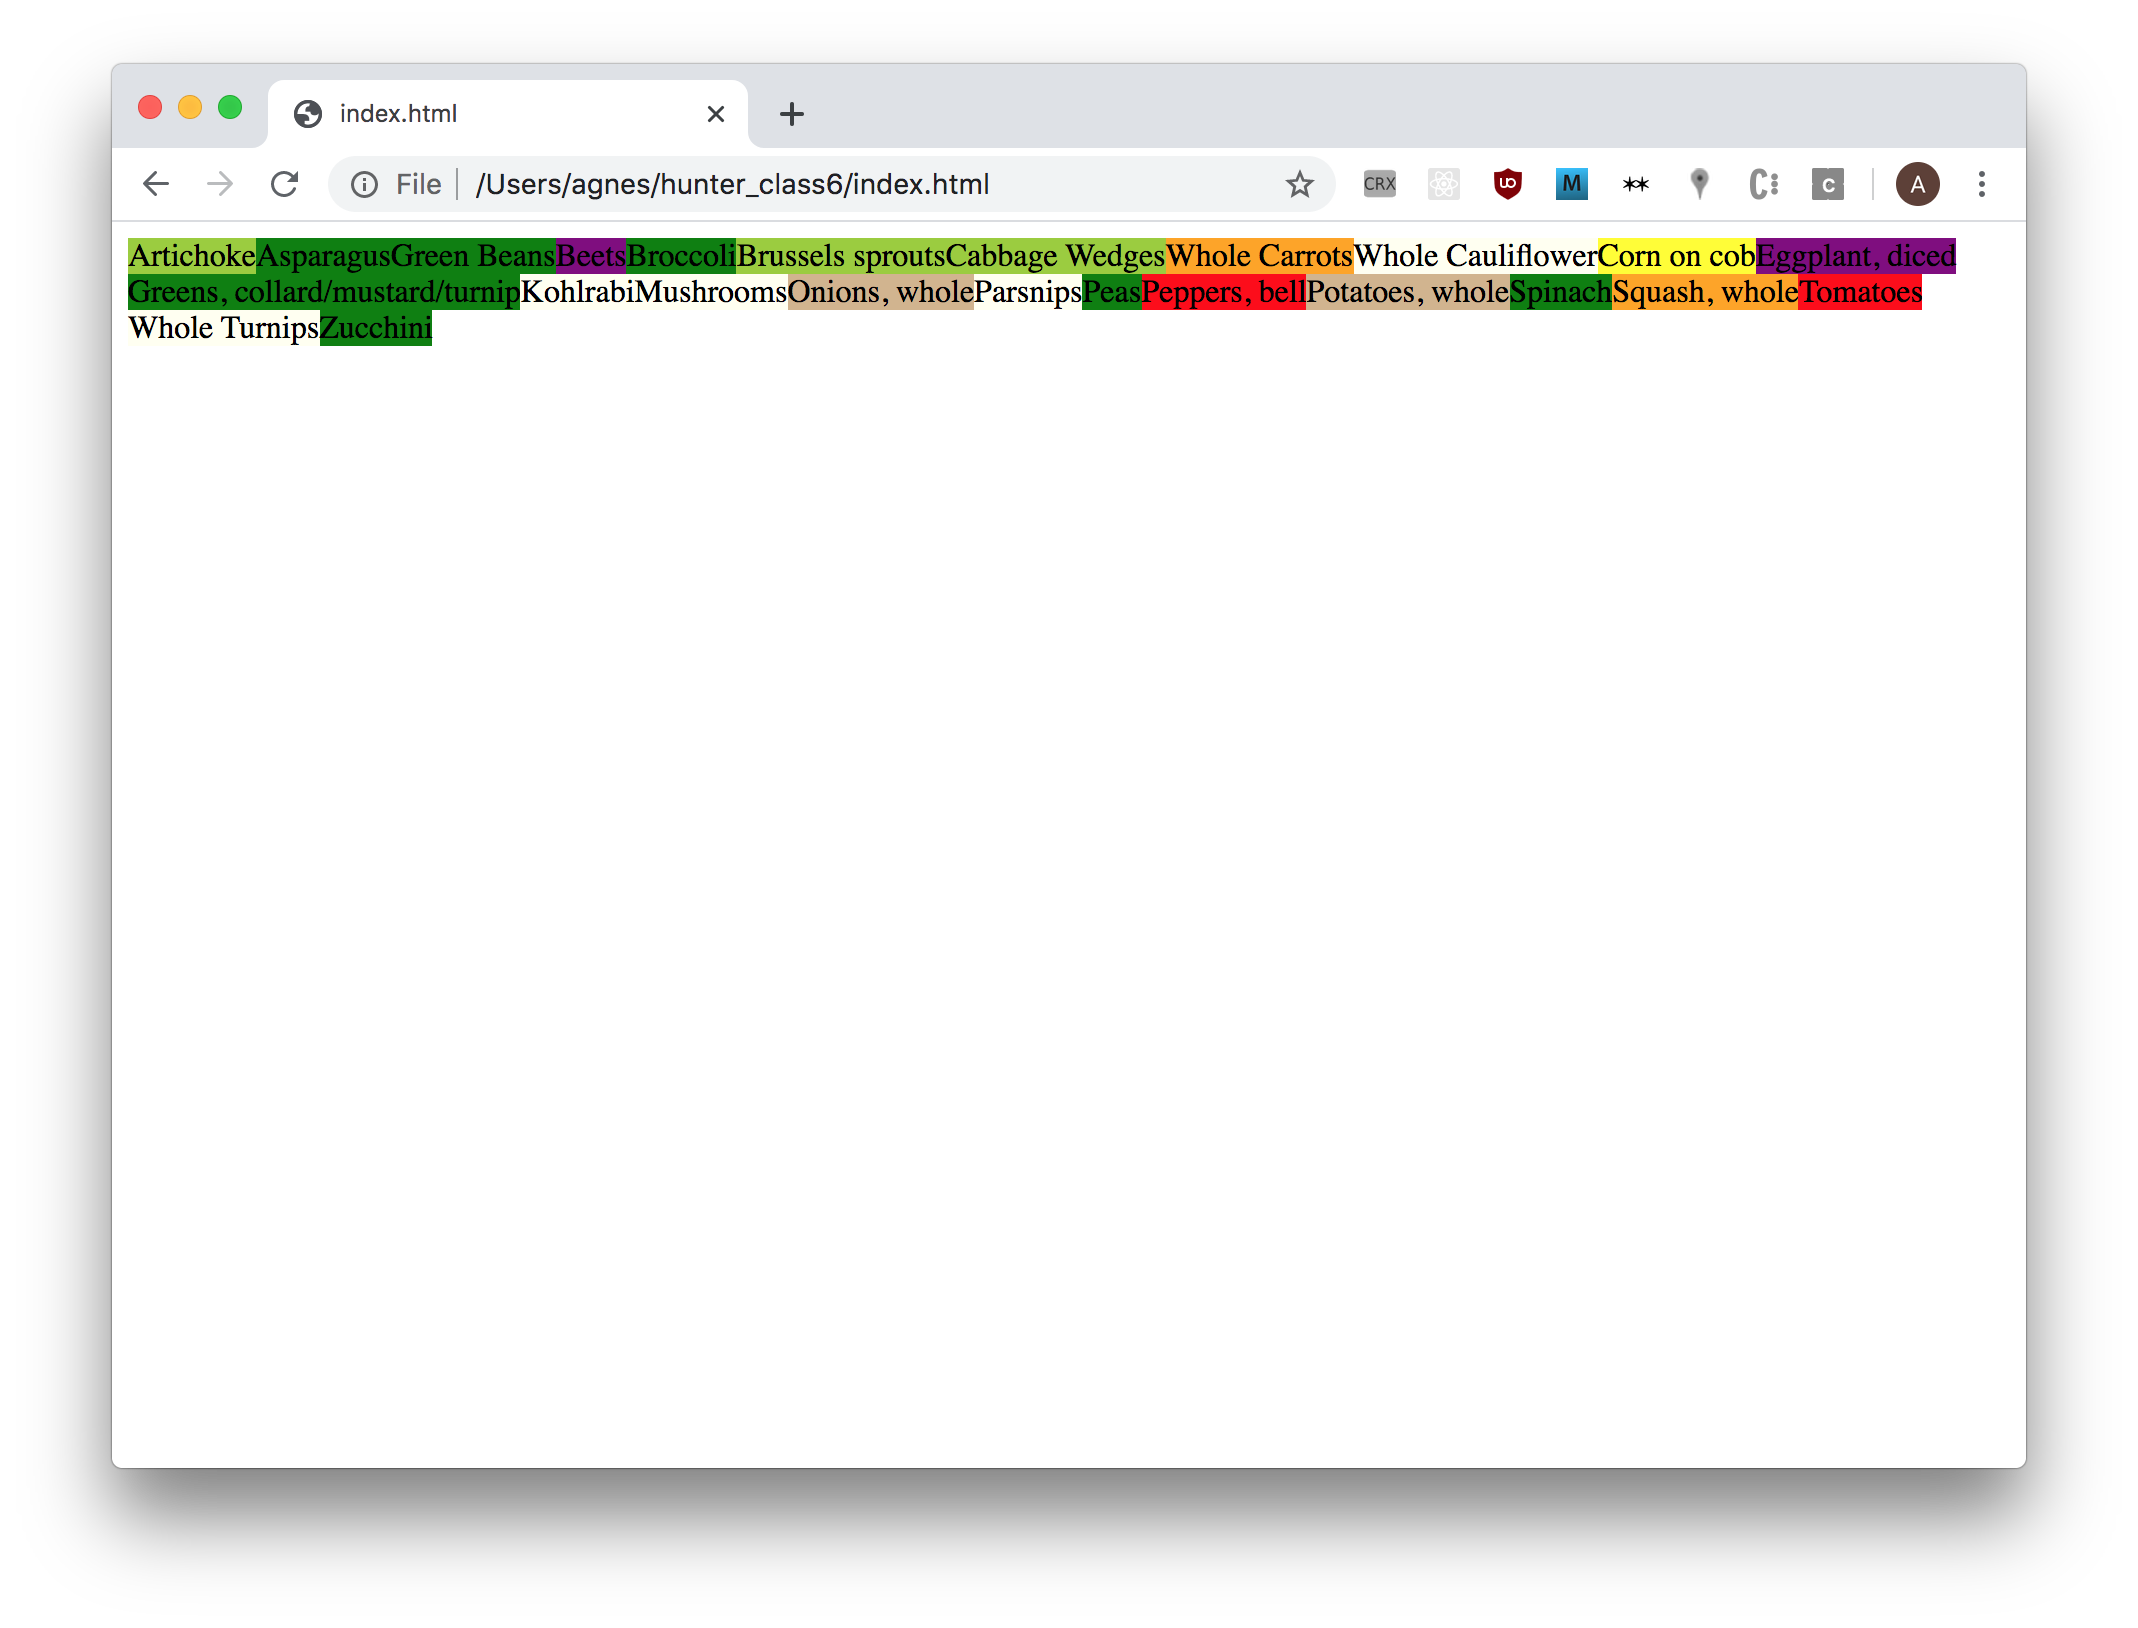
This still isn’t that exciting, but we’re now able to style the boxes. Let’s add in some new information too:
vegTimes.forEach( function(element, index) {
	let vegDiv = $('<div/>', {
    	id: element.name
	})
	.html(element.name + '<br>' + element.other)
	.css({"background-color": element.color, "padding": "30px"})

	$('.flex-container').append(vegDiv)
})
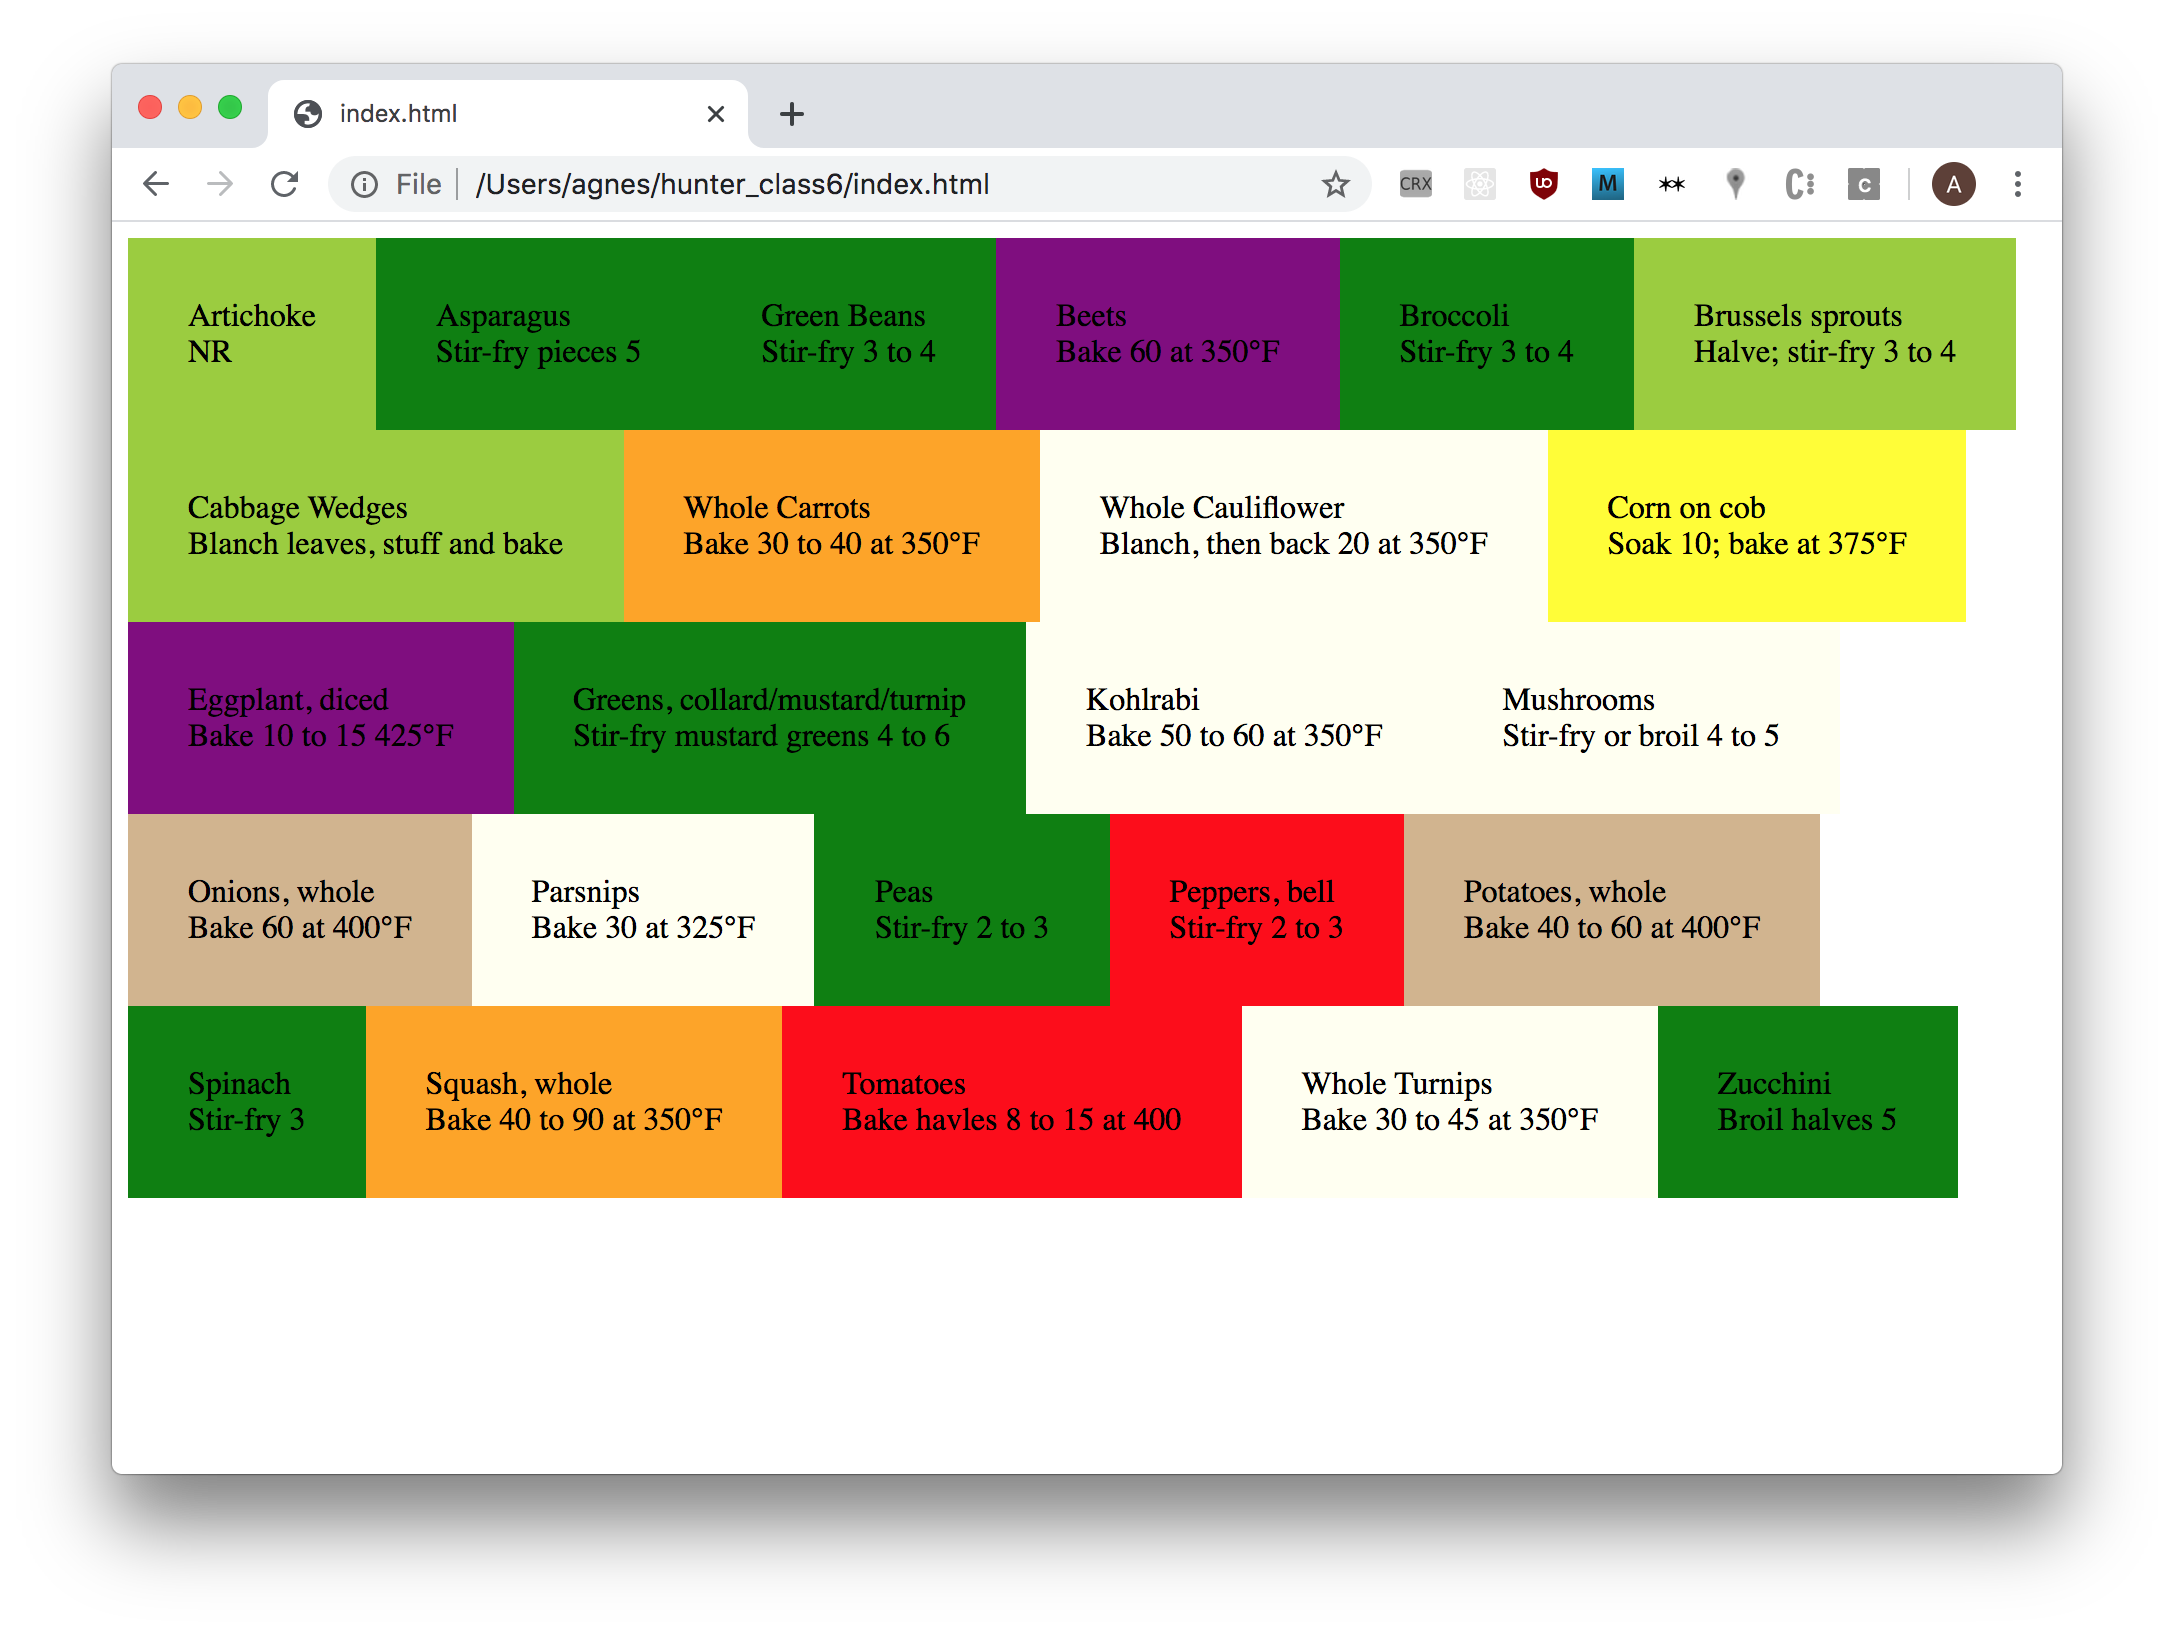
This is starting to look kind of nice! If we want to add more CSS to the boxes, we could give them all a class. Because class is a reserved word in JS, we need to use "class" in quotation marks here… annoying, but otherwise does what it looks like!
vegTimes.forEach( function(element, index) {
	let vegDiv = $('<div/>', {
    	id: element.name,
    	"class": "vegetable"
	})
	.html(element.name + '<br>' + element.other)
	.css({"background-color": element.color})

	$('.flex-container').append(vegDiv)
})
and then you can modify the CSS however you like: play around with some properties!
.vegetable {
	padding: 30px;
	font-family: helvetica;
	border: 2px solid black;
	margin: 3px;
}

.vegetable:hover {
	padding: 60px;
}
There’s loads of other things you can do with flexbox: if this seems like something you’d be into, I highly recommend the tutorial flexbox froggy.
other arrangements
Another thing we can do is arrange things using the position property. This can be particularly interesting for data which is numerical. For example, perhaps we wanted to make a webpage that plotted the time needed to steam a vegetable against the time it takes to microwave it.
vegTimes.forEach( function(element, index) {
	let vegDiv = $('<div/>', {
    	id: element.name,
	})
	.html(element.name)
	.css({"position": "absolute", "left": 50*element.steamed, "top": 50*element.microwaved})

	$('body').append(vegDiv)
})
Here, we position the elements based on the time it takes to cook them. In order to make this kind of positioning work, we need to change the position property of the div to absolute. This allows us to position in a fixed way, relative to the parent (in this case, the page body).
This gives us an output that should look something like this:
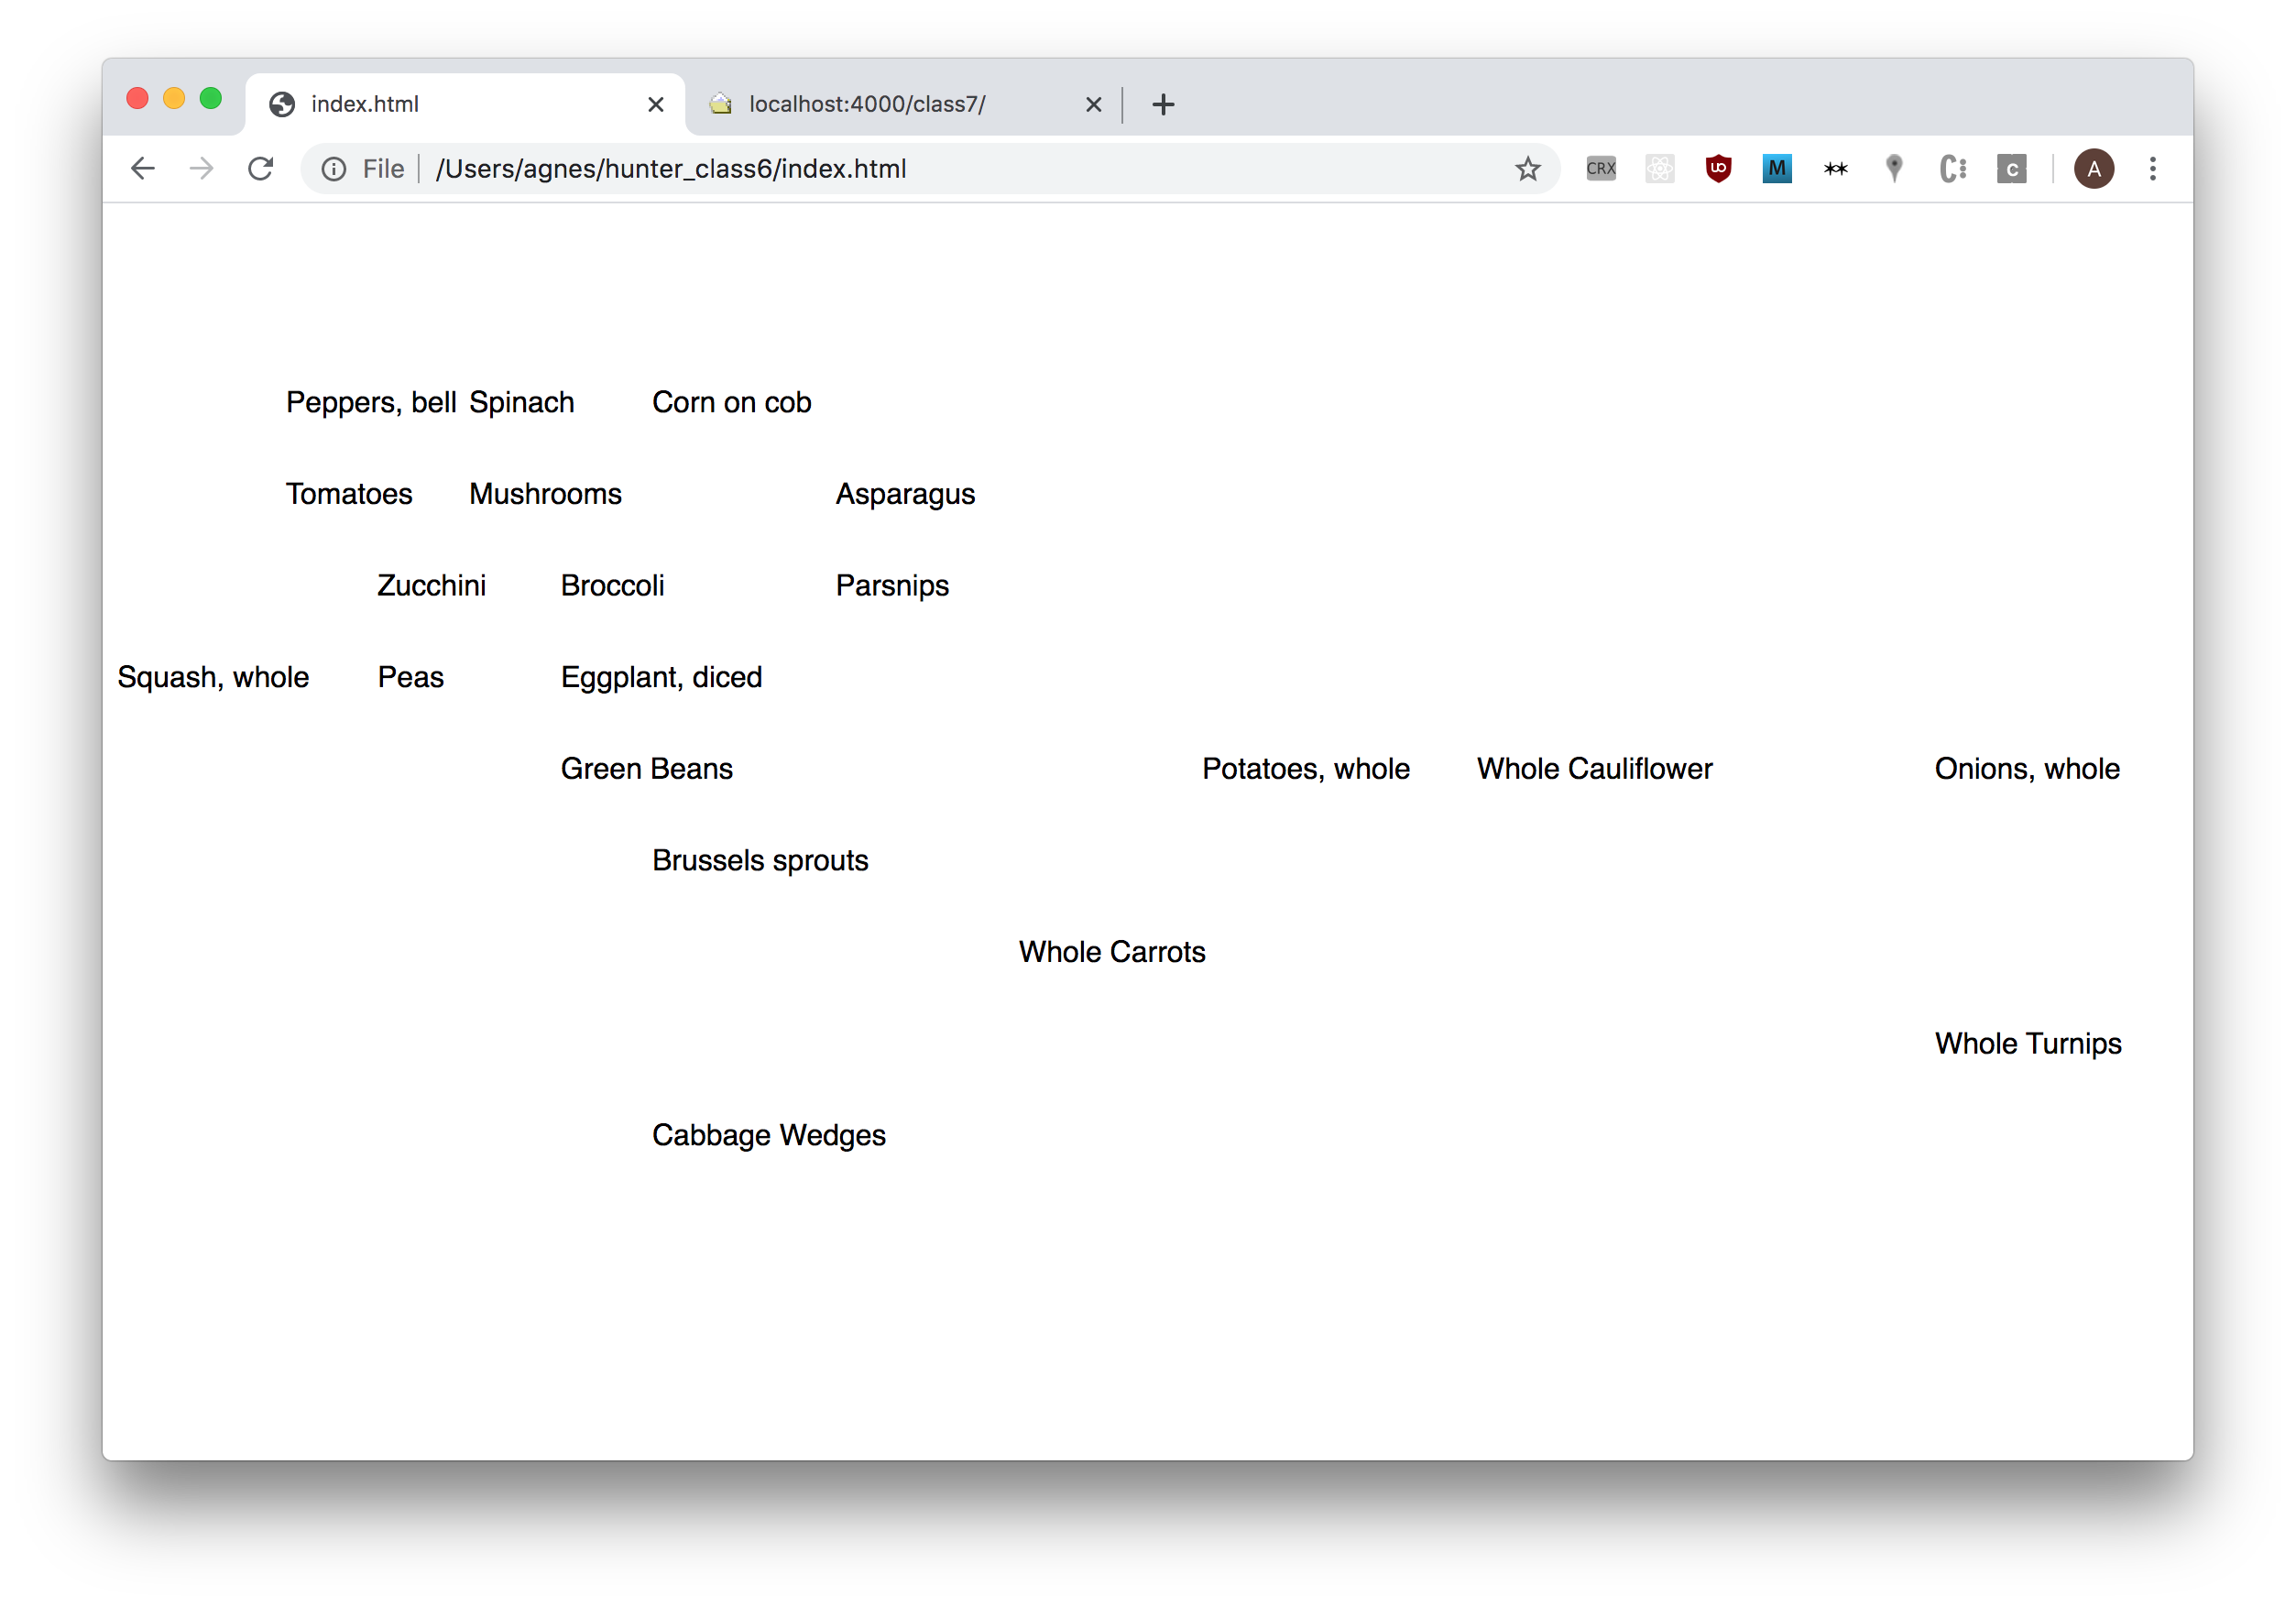
But! Notice that the quickest-cooking vegetables get positioned in the top left, not the bottom left! This is because webpage coordinate systems have their (0,0) in the top left corner, rather than the bottom left, like most graphs we would look at. We can rectify this, by subtracting the position from the height of the viewport.
We can get the height of the viewport using $(document).height(): this gets the current height of the document object.
vegTimes.forEach( function(element, index) {
	let vegDiv = $('<div/>', {
    	id: element.name,
	})
	.html(element.name)
	.css({"position": "absolute", "left": 50*element.steamed, "top": $(document).height() - 50*element.microwaved})

	$('body').append(vegDiv)
})
ta-da! If you’re bored, try adding axis labels
in class:
check in
What data did peple scrape? And what did you think of the readings?
lecture: representing knowledge
What does it mean to represent information on the web? What different forms of representation do you encounter every day? We’re constantly switching between different forms of representation: from maps to feeds, from menus to recipes. Over time, we learn certain expected behaviours and symbols that come with different arrangements: we scroll top-to-bottom on social media sites, we zoom in and out on online map viewers, or enter different co-ordinates to find out destination. We expect our options to be in a list, our alphabet to be arranged in a keyboard.
This is a vast, expansive topic, and one we can’t hope to do justice to in such a short period of time! It’s also an interesting and rewarding thing to be thinking about with regards to the web, and so today we’ll spend some time thinking around the arrangement of information. The net is a medium that follows in a long lineage of ways of organising knowledge collectively, preceded by libraries, atlases, oral histories and archives. I’ve gathered a lot of different examples of information-organisation below: we won’t go through all of them, but I’ve left these up as things you might enjoy looking at in your own time.
What I would like to spend some time on is, specifically, judgements about how to arrange objects on the web.
This is a really big part of web design: what would be an appropriate way to display all of this information, to make it navigable by someone, to make certain arguments or show certain intentions. How, for example, do the different designs of Wikipedia and Google Knowledge Graph speak to different ideas of how information should be created, arranged and displayed.
There are many philosophies of how best to do this! I’m not going to tell you any is better than the others, but what I will say is that it’s always important to be intentional about the decisions you make. Don’t just default to a convention without thinking critically about it!
charts
co-ordinate systems
cartesian polar
phase diagrams
political compasses
culture wars recipe collection meme collection
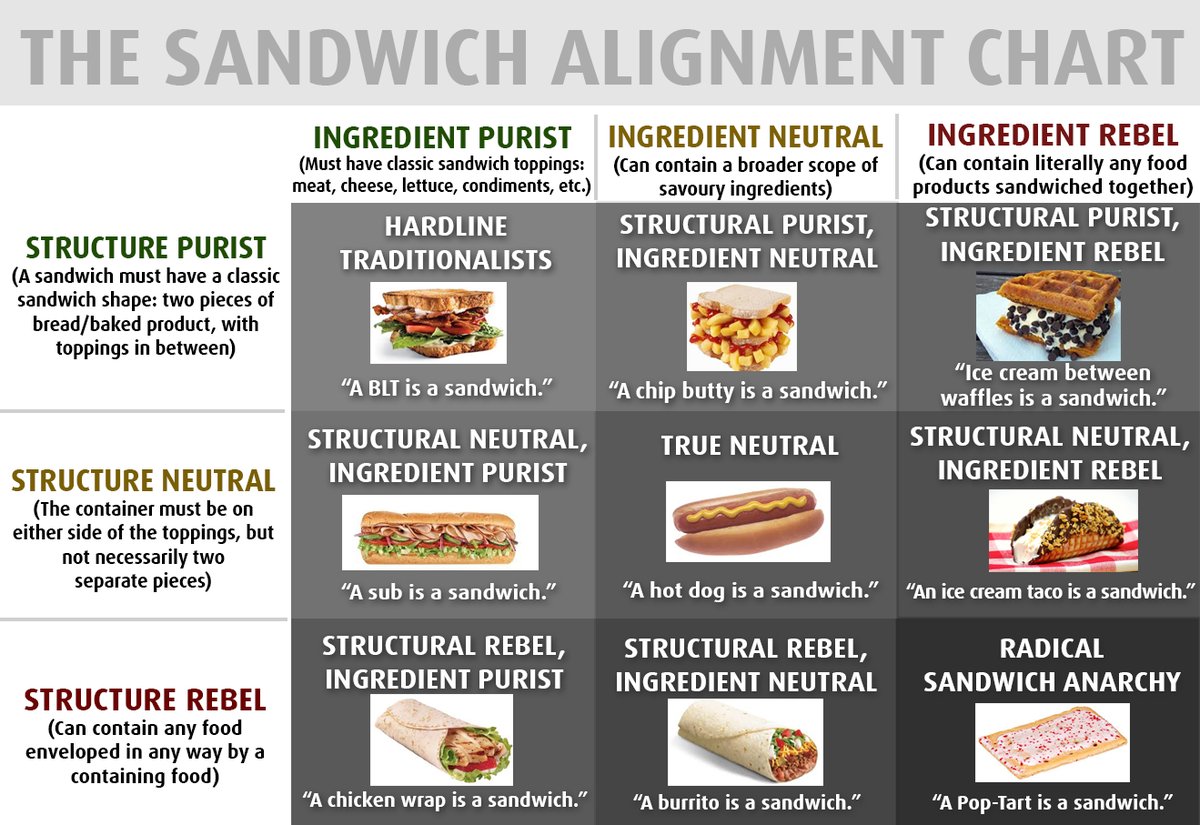
alignment charts sandwiches meta-alignment chart
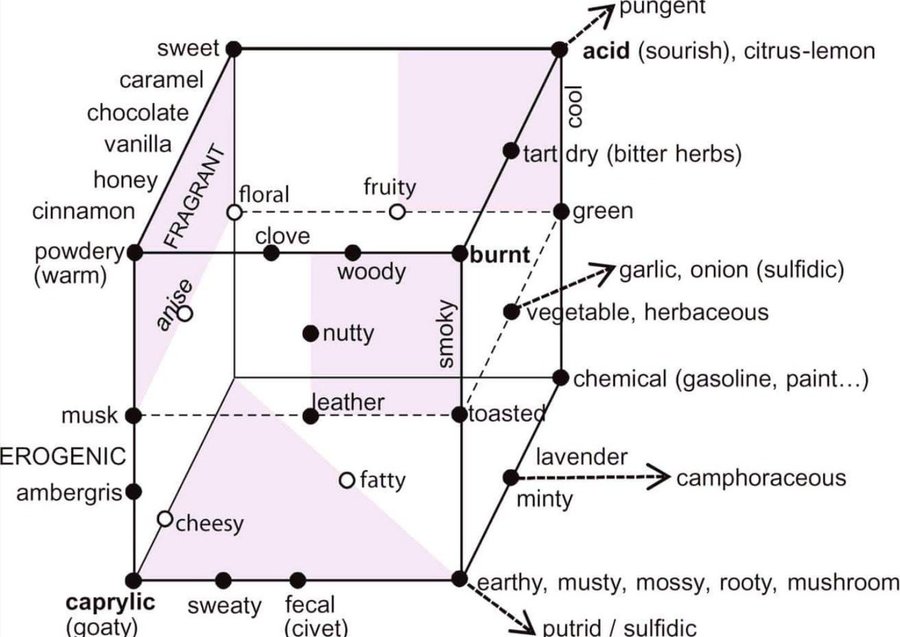
smells
trilemmas
good/fast/cheap energy
maps
map libraries
openStreetMap mapbox google maps
map visualisation
stamen
counter mapping
bill bunge native land queering the map conquer and divide white collar crime risk zones
geogoo
land lines documentation
oyvind fahlstrom
mind maps
patrick gunkel
“bio-evolution did not seek to optimise the taste of natural foodstuffs” network relationships universes
bureau d’etudes world government the 8th sphere
anatomy of an ai
tools
scapple coggle kinopio nototo
visualisations
clustering
butterflies
stranger visions
VFRAME
officer involved fatal migrations
nyt air pollution
visible connections
are.na
roam research
the music maze
metaphors
back when we thought the internet was like a city deleted city
drawing libraries
html5 canvas
processing js -> p5 js
networks
graphs
d3.js
blobs
paper.js staggering beauty
3d
babylon.js
in-class exercise
In this exercise, we’ll make a start on the week’s assignment together to walk through issues and talk about our ideas for the week.
-
In your groups, discuss together the kind of data that you have. How might you think about displaying it? make some sketches (use a pen and paper, or your new photoshop licenses!), or verbal description, and talk about them as a group.
-
Together, pick one of the sketches, and break down the steps required to make it. What kind of methods might you make use of?
-
If there’s time, try prototyping (either in pseudo-code, or real code) how you’d display that data on a webpage.
assignment
due 03/22
using jQuery (and anything else you choose), display the data set you collected last week in a few different ways.
Can you see patterns and relationships in the data? How do you link between different ideas? When you display the data a particular way, does it give you something you didn’t expect? What does it feel like to explore your data set?
If you don’t want to use the data set you collected last week, feel free to use one of the ones we’ve explored in class.
readings:
Brandur Learning from Terminals to Design the Future of User Interfaces
Alexis Madrigal, The Lost Ancestors of Ascii Art
inspiration
yale aids memorial project
conquer and divide
net art anthology
future expansion – a building about buildings
CAVS
backseat frying
radical essex
diagrams of thought