browser extensions
covid-19 update
we are learning to use Zoom.

Let’s talk about how we want to organise this class going forward.
lecture: producing larger coding projects
In this lecture, we’re going to introduce two really powerful ideas: one code-based, and one conceptual. First, we’ll look at iterators – tools in Javascript for allowing us to repeat the same instruction multiple times, which will let us realise much more complex and exciting projects. We’re also going to talk about iterators again next week when we cover objects, so think of this as a friendly taster.
After that, we’re going to look at debugging tactics. Good debugging is essential to realising larger coding projects – and indeed, most of getting better at writing code is really just getting better at resolving bugs. This can be frustrating and un-rewarding when you first have to do it, but you’ll be surprised how rapidly things get easier as you learn the source of common issues.
We’ll cover both of these from the perspective of our browser extensions. To get you all started for this week, I’ll send round a
iterators
Iterators are a way of performing an action multiple times. In our current context, there may be many things on a page, and we might want to do something to each of them. For some things (like changing CSS) this can be as simple as using jQuery to select all the elements, and do something to them at once, like:
$('div').css({'background-color': 'pink'})
However, iterators can also let us do more complex things. We’re going to cover a variety of iterators next week, but for now we’re going to focus on jQuery’s .each() method. This allows us to select a group of things, and for each thing, perform some action.
structure of a .each() function
The function below gives a typical layout of a jQuery .each() method.
$('div').each(function (index, element) {
	console.log(index)
})
the first part selects the thing we’re looking for: in this case, all the divs on the page. The next part takes the form of an anonymous function – one of the things we met last week. However, this anonymous function also has 2 arguments: index, and element.
Where do they come from? They’re built in to the method .each: they allow us to access the element we’re thinking about, and the number – index – of that element.
If we open up our console, we’ll see a number logged for each div on the page. sweet!
debugging
This is by far the most important skill you will develop in this class! By now, all of you have probably encountered some kind of ‘bug’. You wrote some code, and it didn’t behave as you expected. Or – you tried to commit your work to git and you got an error instead. What did you do to solve it?
‘Debugging’ refers to the process of finding and resolving issues in code. The word ‘debugging’ is attributed to Admiral Grace Hopper, one of the first programmers of the Harvard Mark I computer, and comes from when computers were the size of rooms, and relied on many tiny moving parts. Engineers would joke that there were ‘bugs’ in their code, preventing the machines from working.

Debugging is an essential skill in software development, and encompasses a range of approaches to determine why a problem might be occurring (these days unlikely real bugs, though there was a pidgeon in CERN a couple of years ago). While there are many different tactics and techniques for debugging, they may be characterised more generally by:
- a process of elimination: finding all the possible sources of the problem, and slowly narrowing them down
- reproducing a small, simple version of the error
- attempting to explain the error to someone else (🐥)
Part of learning how to debug code is also learning how to write code that’s easy to debug. The golden rule:
every time you add new functionality, test thoroughly that it works then commit it to your git before adding anything else or changing it
This way, your application develops in stages, and you do not lose functionality by making mistakes. In particular, it helps with the process of elimination: testing after each change means that you know which change might have been the source of the error.
general debugging tips
1. console debugging
If things aren’t working as expected, the first thing you should do is open up your browser console, and read what’s there. First of all: is there anything in red? If so: is that message relevant to your code. Below are some console error messages that you might encounter:
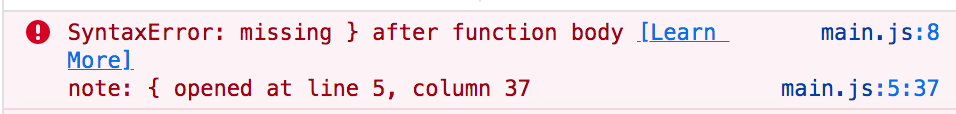
This is a pretty standard error, and it’s telling us that we’re missing a closing }, perhaps on a function.
Another common one is the error message unexpected token '{'. This is a little more cryptic, but generally means that we’re missing the () from a function declaration. E.g.
function doSomething {

}
is wrong, but:
function doSomething() {

}
is right.

This is a really common error in Javascript when you forget to put quotation marks around a string. When the browser reads the line, it thinks you’re talking about a variable, and it gets stressed when it can’t find it.
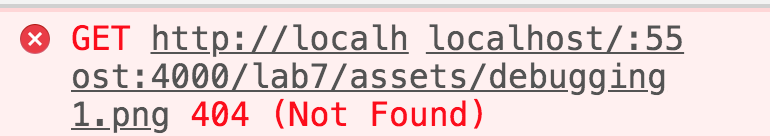
This one is saying ‘resource not found’! It means that we’ve tried to load a file that the browser can’t find. In this case, it’s a good idea to look at where the browser’s looking for the thing we want it to see. In this case, it’s looking in the wrong folder for …. the image i tried to add just above!

This guy, however, doesn’t seem to have much to do with us: instant.page doesn’t appear anywhere in our code, and is probably an error that the website is having itself. Most large websites will have a number of errors in the console associated with different things happening on the page.
2. elimination Perhaps you have a problem, but there’s no error in the console to help you figure it out. Say,
3. looking online
Online forums like Stack Overflow are invaluable in solving issues with your code. Normally, instead of searching stack overflow directly however, I run a google search with a short description of my problem, which will throw up relevant resources. Learning how to structure these searches is a big part of getting better at debugging: it’s normally a good idea to include
browser-extension-specific debugging
Below, we’ll go through some common issues that you might encounter when trying to debug a browser extension, going from really simple, through to some that are much harder to solve. I encountered all of these while making a browser extension to show you all in class.
Google Chrome makes it much easier to debug browser extensions, so for this reason we’re going to add them to Chrome. Chrome and Firefox extensions both have exactly the same extension structure, though Chrome is much more likely to let you know when there are issues!
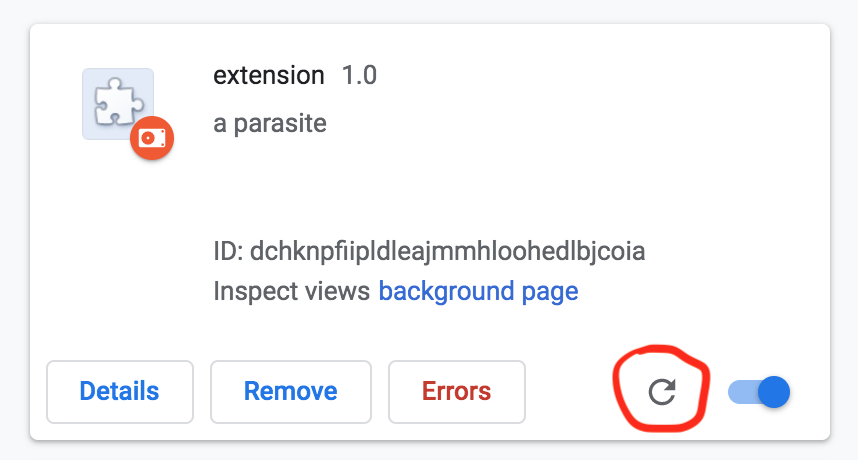
1. Have you reloaded the extension? This sounds obvious, but probably added at least 10 minutes worth of head-scratching to the process, as I would change code and repeatedly look at the browser, only to see it not change. You don’t need to remove and re-add the extension each time, but you do need to use the little refresh button to make sure the code updates.
If you get bored of doing this (I did), you can download a tool called web-ext. To do this, you need to have NodeJS installed. This will allow you to run your extension and have it automatically reload.
2. are the paths to the files correct?
For javascript to load properly, you need to make sure that you’ve got the right filepaths in your manifest.json file, and that all the paths in there are relative to that file.
Adding images involves something a little trickier: we need to use web_accessible_resources to make them available to the extension, then include them in files using:
chrome.extension.getURL("img/potato1.jpg")
This allows the browser to calculate the path to the image, and load it into the site that you’re currently using.
An alternative to this is just to use external URLs for your images.
3. original CSS can cause problems with new CSS When editing a page’s CSS, it’s essential to look at the structure of the page you’re trying to style. Sometimes, it’s easier to change CSS dynamically using Javascript rather than relying on a static CSS file.
If you’re wondering how to get something to work, try running that command in the console first and see what it does.
4. on more complex sites, browser elements might not be what you think they are When making the potatoes extension work earlier, I was trying to make it work on Wikipedia, and I encountered a problem: just setting the ‘src’ of the image didn’t change the image itself.
When I looked at the console, I could see that src had been changed correctly… but another attribute called srcset had not! I tried also changing the srcset attribute in the jQuery, and that worked.
5. ‘lazy loading’ issues Many of the sites you use day-to-day use something called ‘lazy loading’ to load content. For high-performance sites with lots of images and other media, this can be really usedful for showing the user some of a page before everything has loaded. However, they make life very difficult for browser extensions!
Consider are.na:
The potato extension we used before won’t load in the same way!
Resources
browser extension how-tos
adding CSS
How to add style to a browser extension
‘mozilla: your second extension’
chrome extensions guide
browser extension examples
Activist themed browser extensions
iteration mozilla guide